
Keyword
Fisheries and aquaculture
6 record(s)
Type of resources
Available actions
Topics
Keywords
Contact for the resource
Provided by
Formats
Representation types
Update frequencies
Status
Scale
panaceaKeywords
GEMET keywords
-
The map represent the distribution of resident species of turtles in the Mediterranean Sea based on observations registered in EMODnet Biology Portal. Species list includes the Loggerhead and Green Turtles. Species list is based on ‘Marine mammals and sea turtles of the Mediterranean and Black Seas’, IUCN, 2012.
-
The map represents the distribution of resident species of cetaceans in the Mediterranean Sea based on observations registered in EMODnet Biology Portal. Species list is based on ‘Marine mammals and sea turtles of the Mediterranean and Black Seas’, IUCN, 2012. Species list includes the following cetaceans: Common Bottlenose Dolphin, Cuvier’s Beaked Whale, Fin Whale, Long-finned Pilot Whale, Risso’s Dolphin, Short-beaked Common Dolphin, Sperm Whale, and Striped Dolphin. Species list is based on ‘Marine mammals and sea turtles of the Mediterranean and Black Seas’, IUCN, 2012.
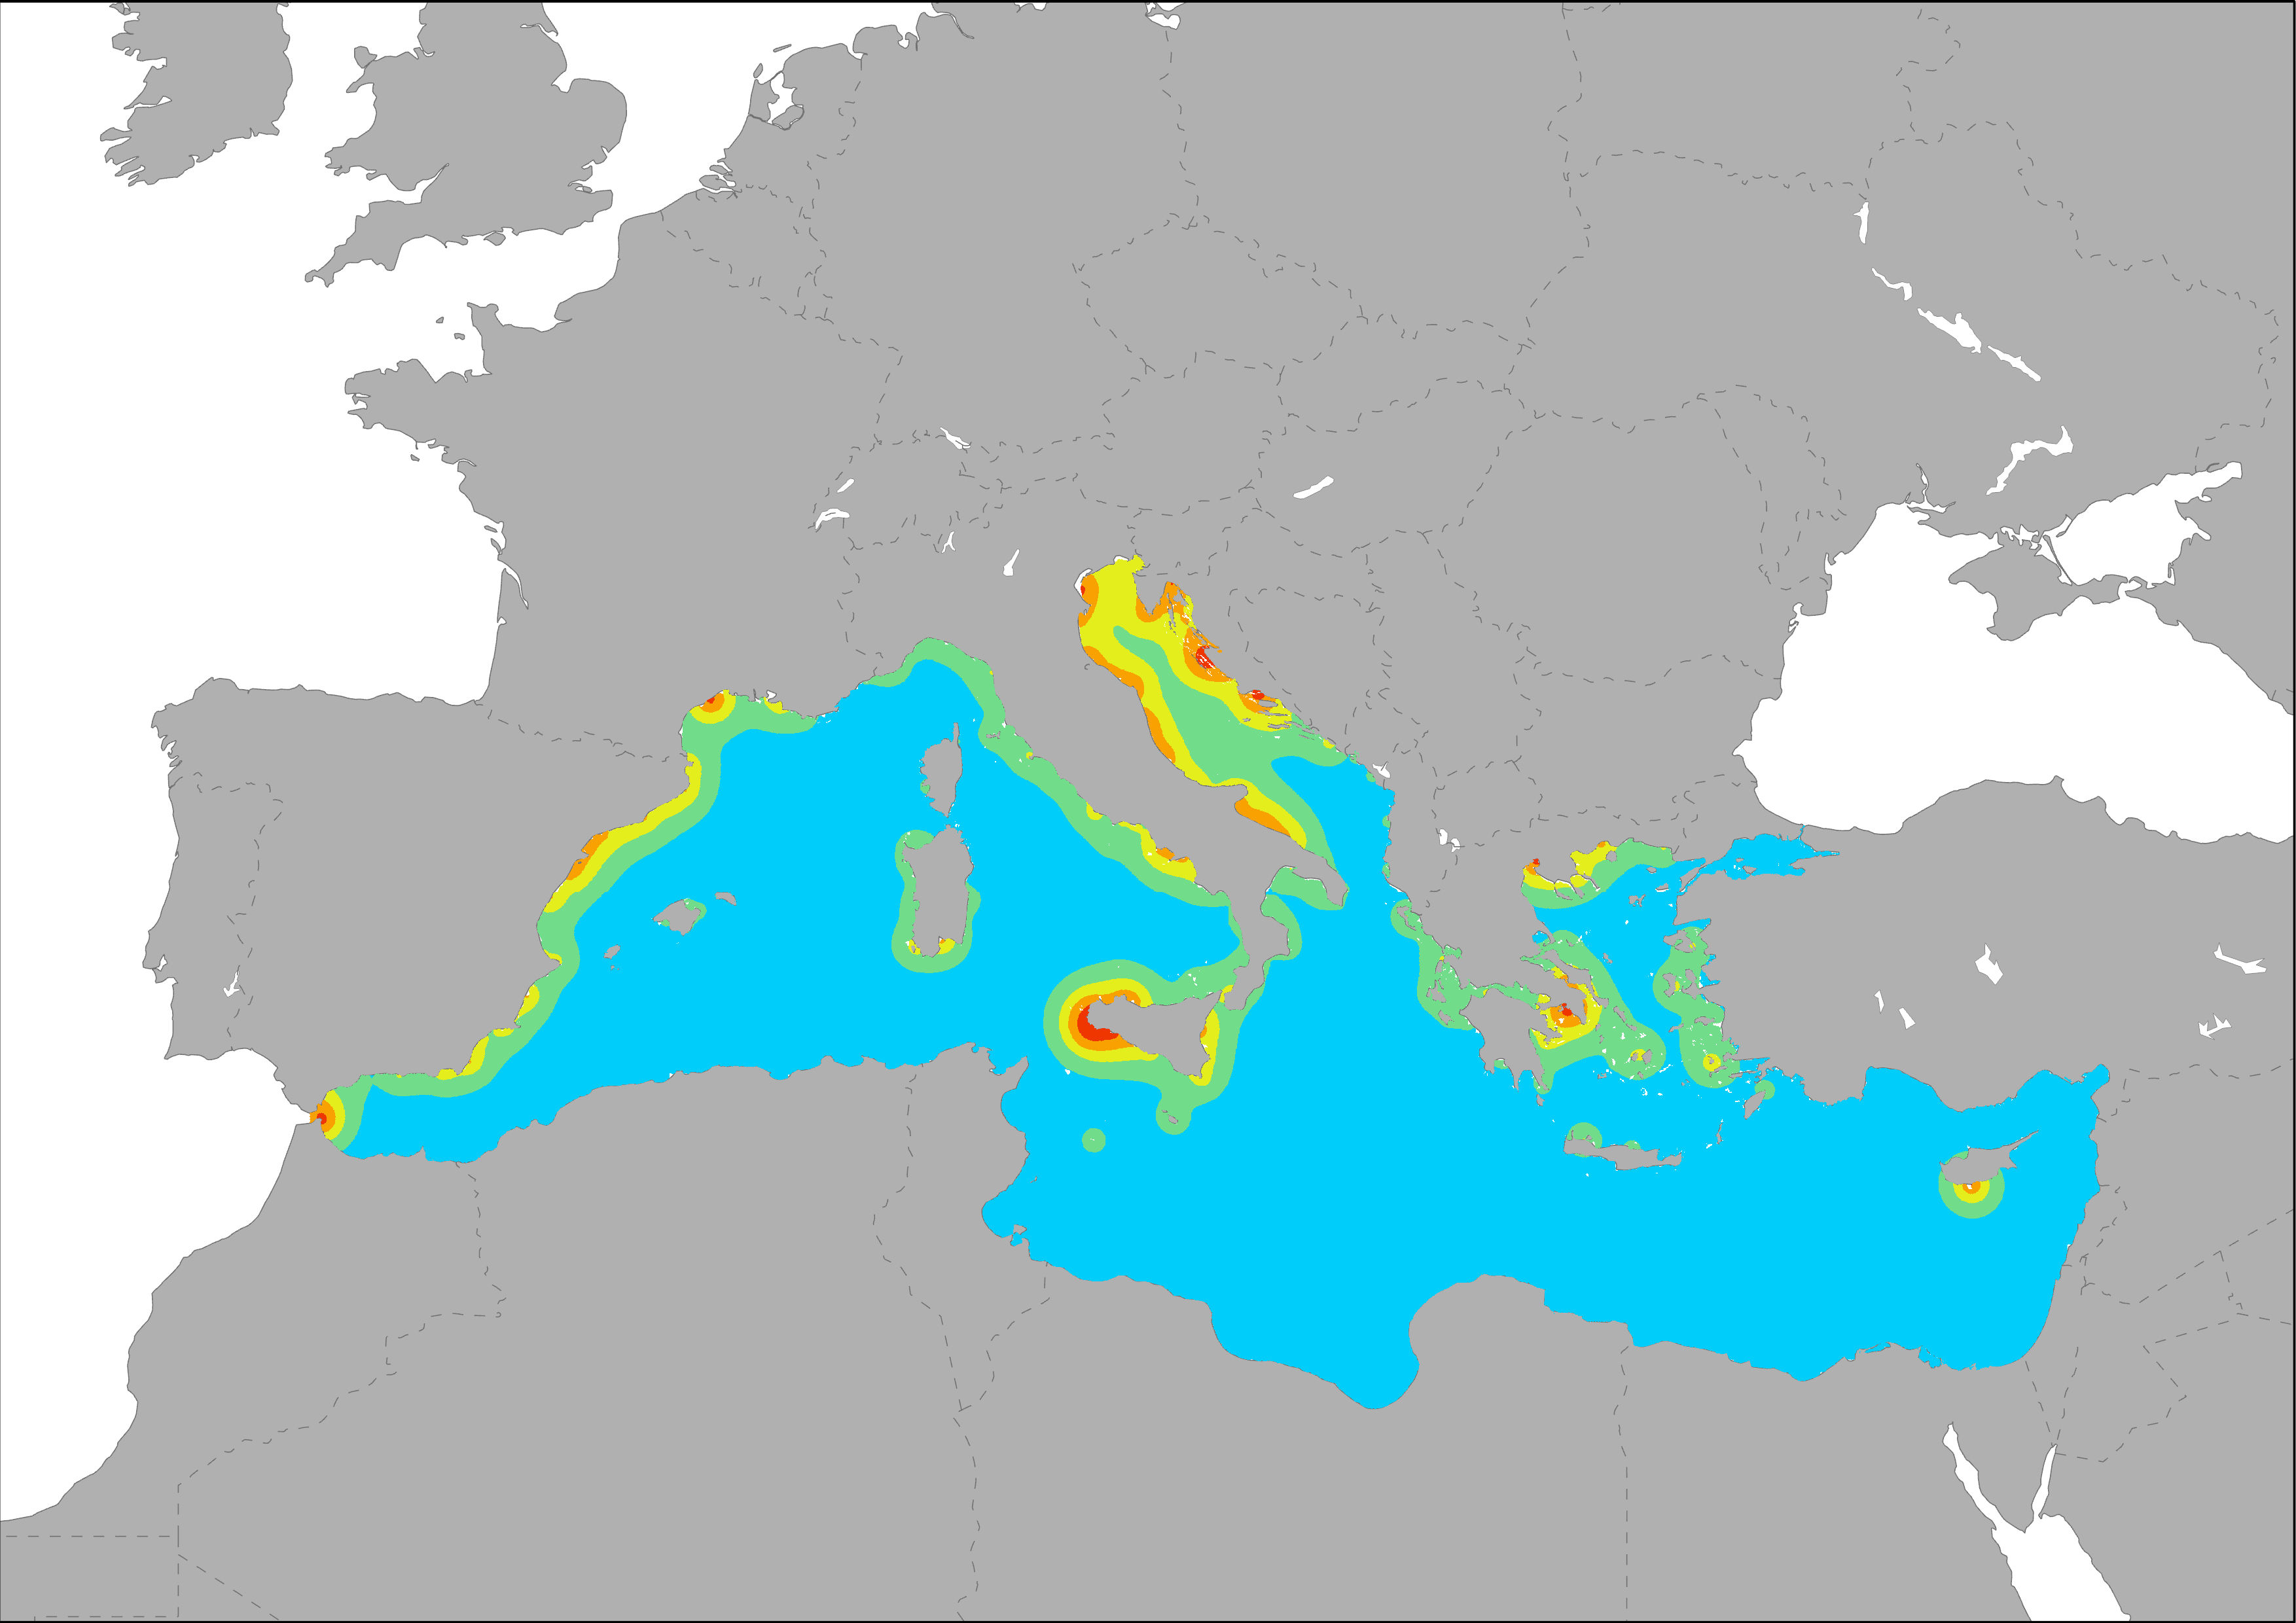
-

The indicator shows the potential pressure generate by fishing activity in regions close to the coast. Med-IAMER developed an expert-based approach to estimate the spatial distribution of fishing activities and the related pressure of harmful fishing techniques on marine environments. This approach resulted in this cumulative fishing indicator, that aims at provide a spatial explicit estimation of main pressures exerted from fishing related activities, particularly trawling and dredging, taking into account the variables for which spatial data are available and that had a specific influence on marine ecosystem. Maximum distance considered is 100 km. Three variables were taken into account to produce this indicator: fishing effort, calculated by a classification of ports according to their fishing fleet tonnage, average vessel length overall and number of trawlers, using the DG MARE database on ports and fishing fleet; soft bottoms above 1.000 meters depth, and main resident endangered species of cetaceans, turtles, sharks and rays threatened by bycatch according to the IUCN Red List and reports.
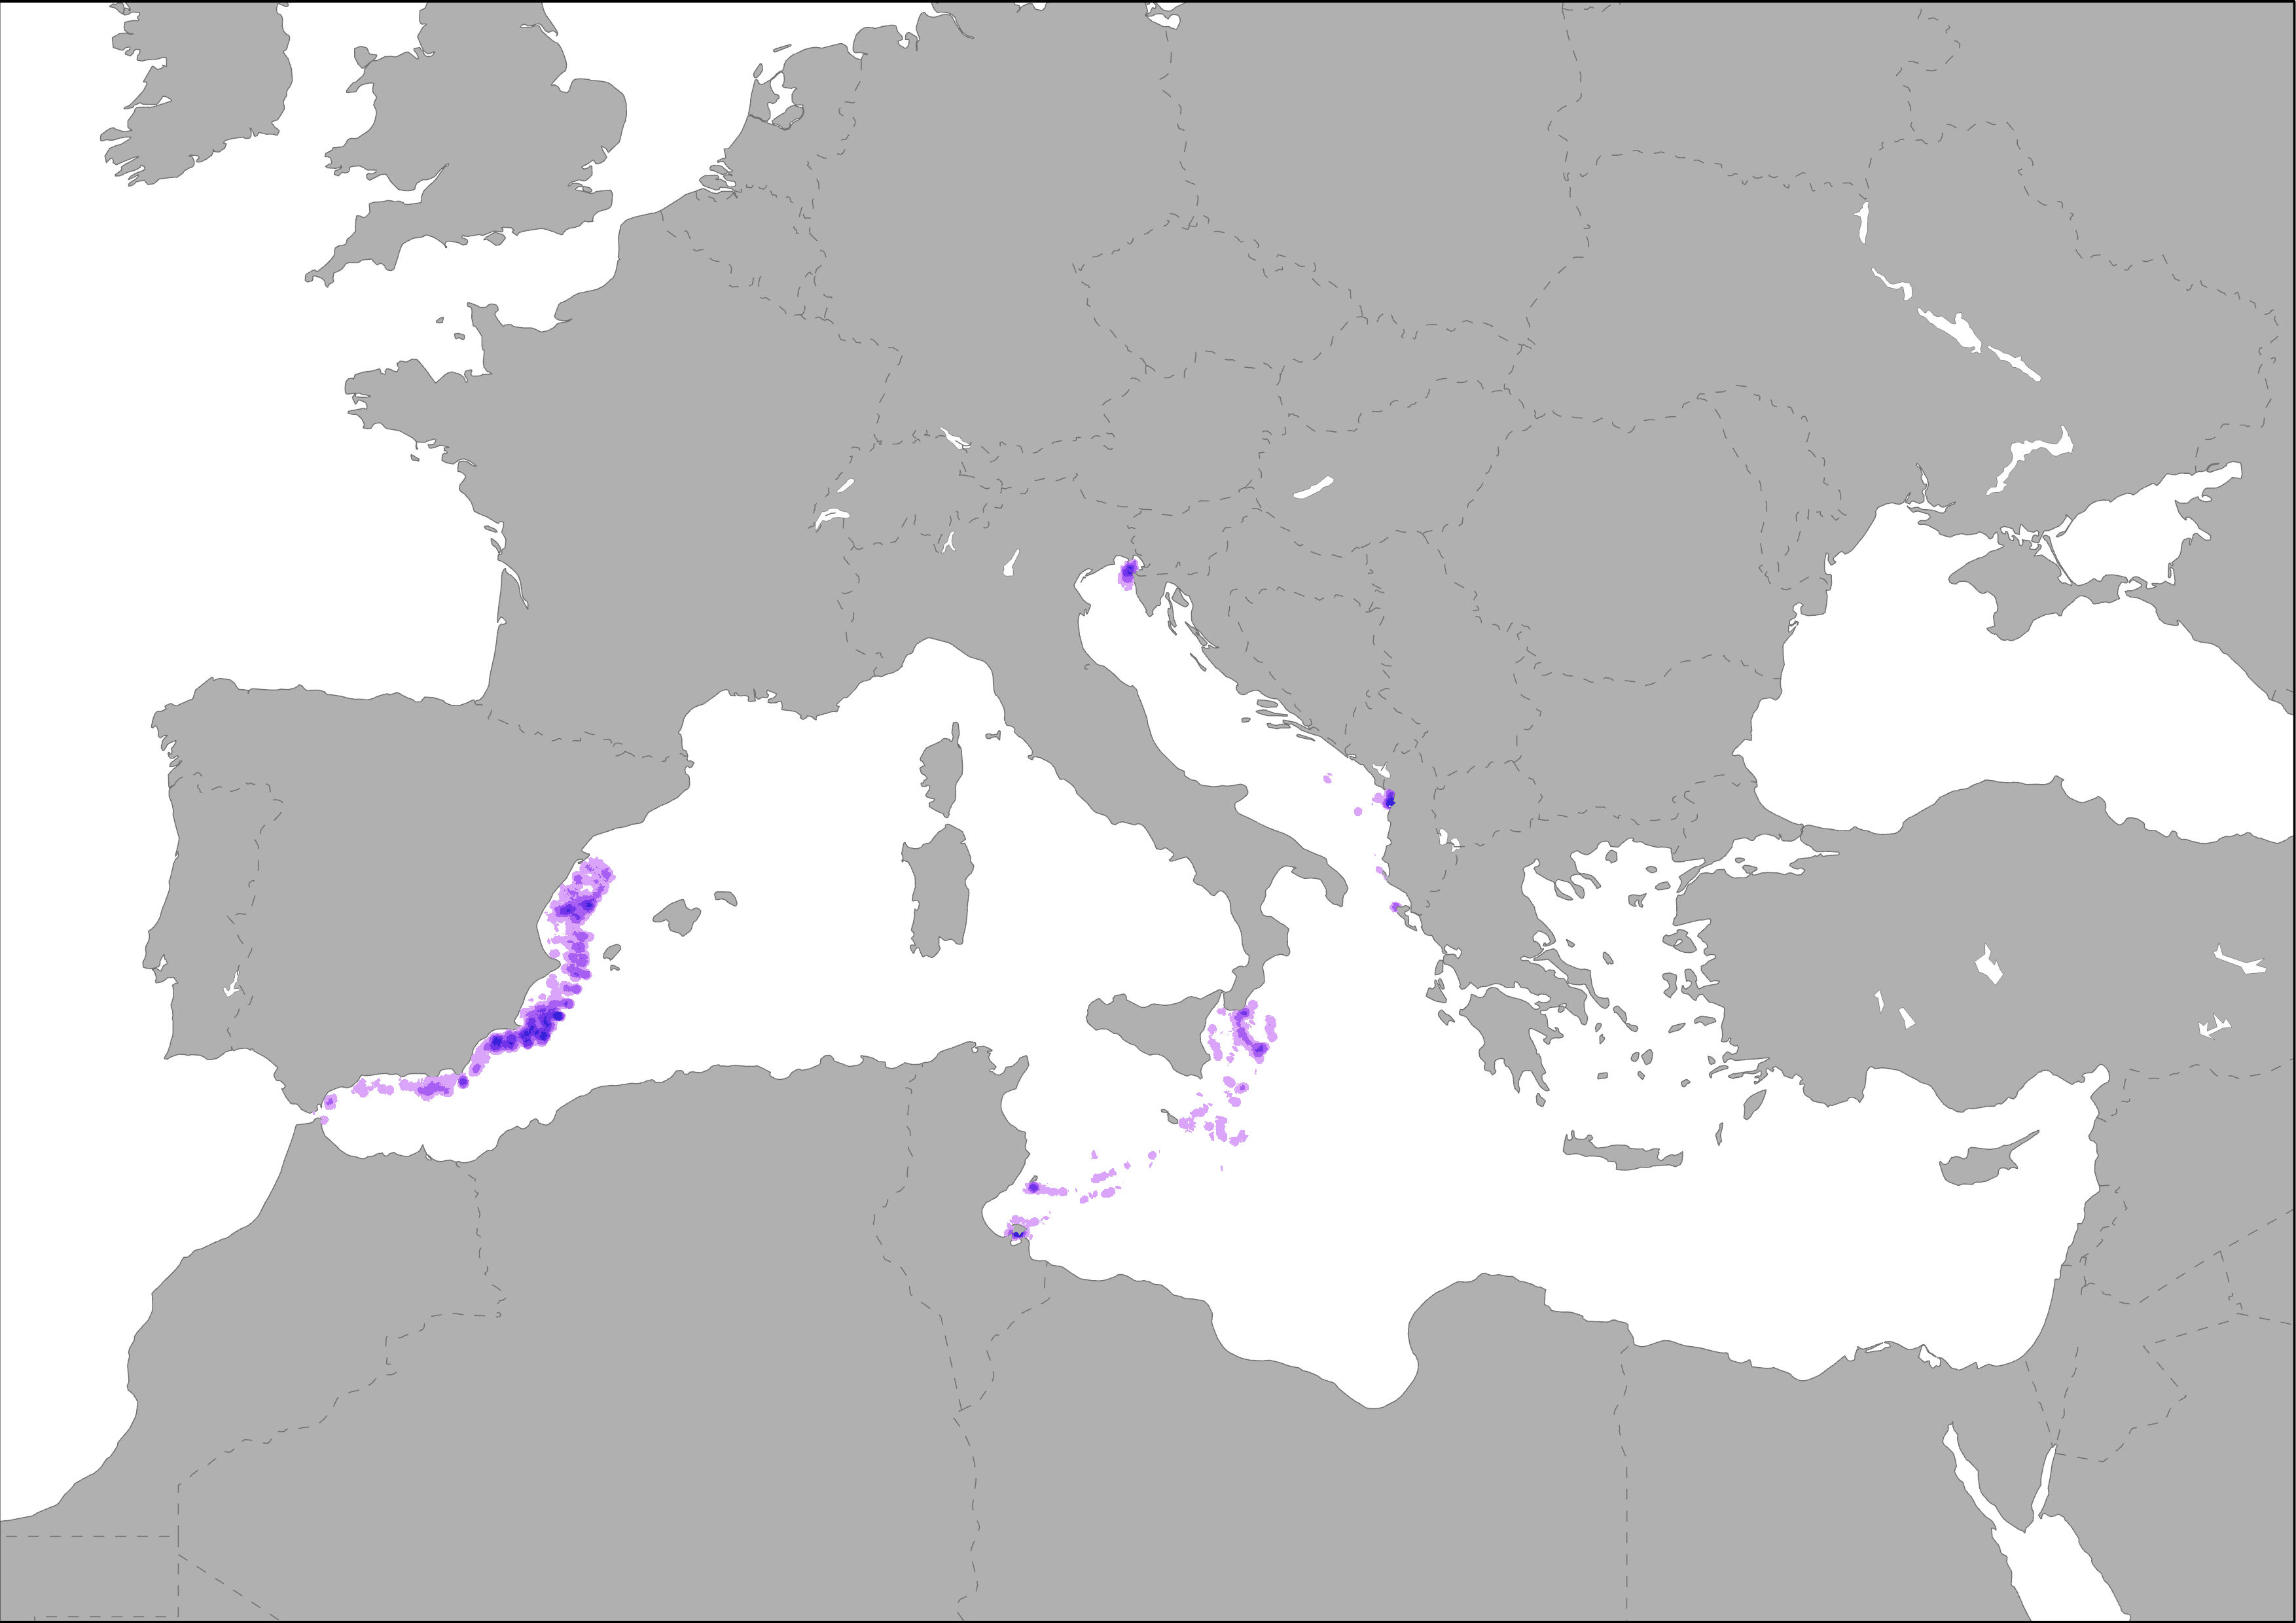
-
This map presents the distribution and marine influence of aquaculture fish farms in the Mediterranean Sea coast. The indicator presents the distribution of aquaculture fish farms (Trujillo et al., 2012 and EMODnet, 2014) in the Mediterranean Sea. Influence area of fish farms (self-calculation) is based on the theoretical maximum distance at which they produce pressure (20 km according to 'Human uses, pressures and impacts in the eastern North Sea, HELCOM, 2012').
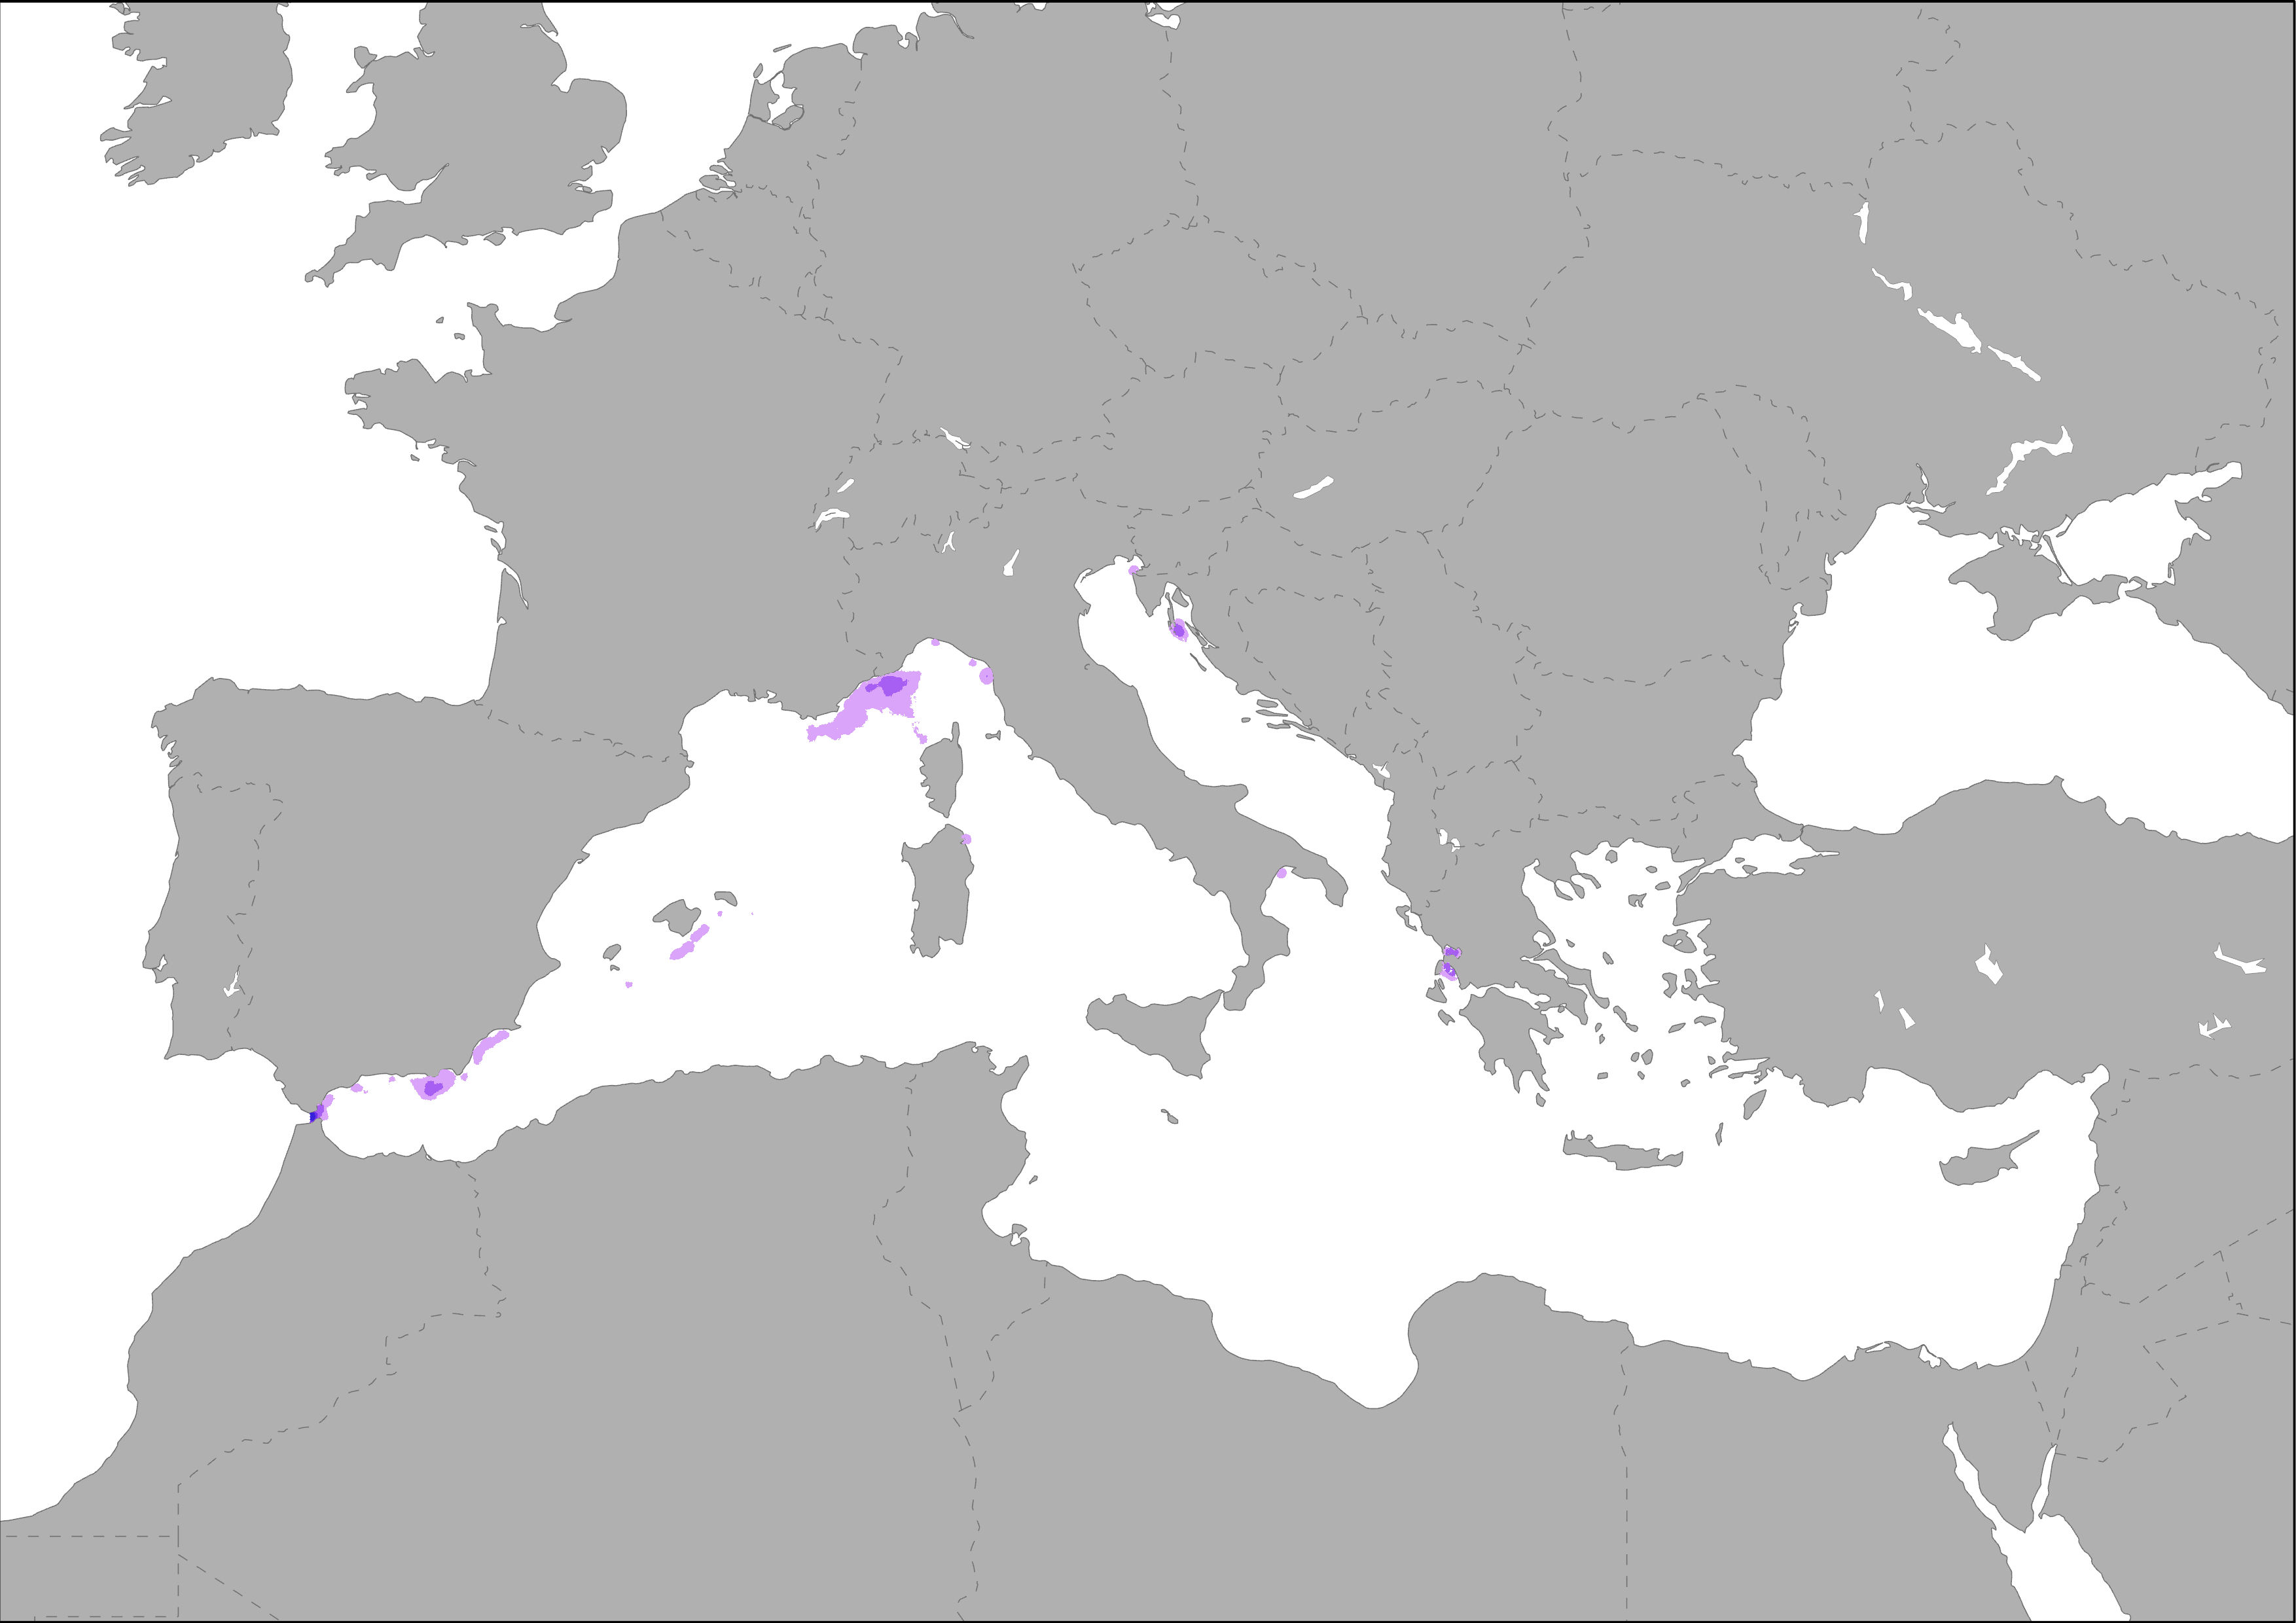
-
The map shows the distribution of main fishing ports in the Mediterranean Sea and its corresponding area of pressure (based on self calculations using the total capacity: tonnage of vessels, DG MARE, 2014). The influence of fishing activity was modeled as a buffer with and exponential decay based on self calculations using the total capacity of the fleet: tonnage of vessels (in gross tonnage, GT). This indicator is based on fleet stats of DG MARE, 2014. Calculations were made following the same methodology developed for ESaTDOR Project (ESPON, 2013).
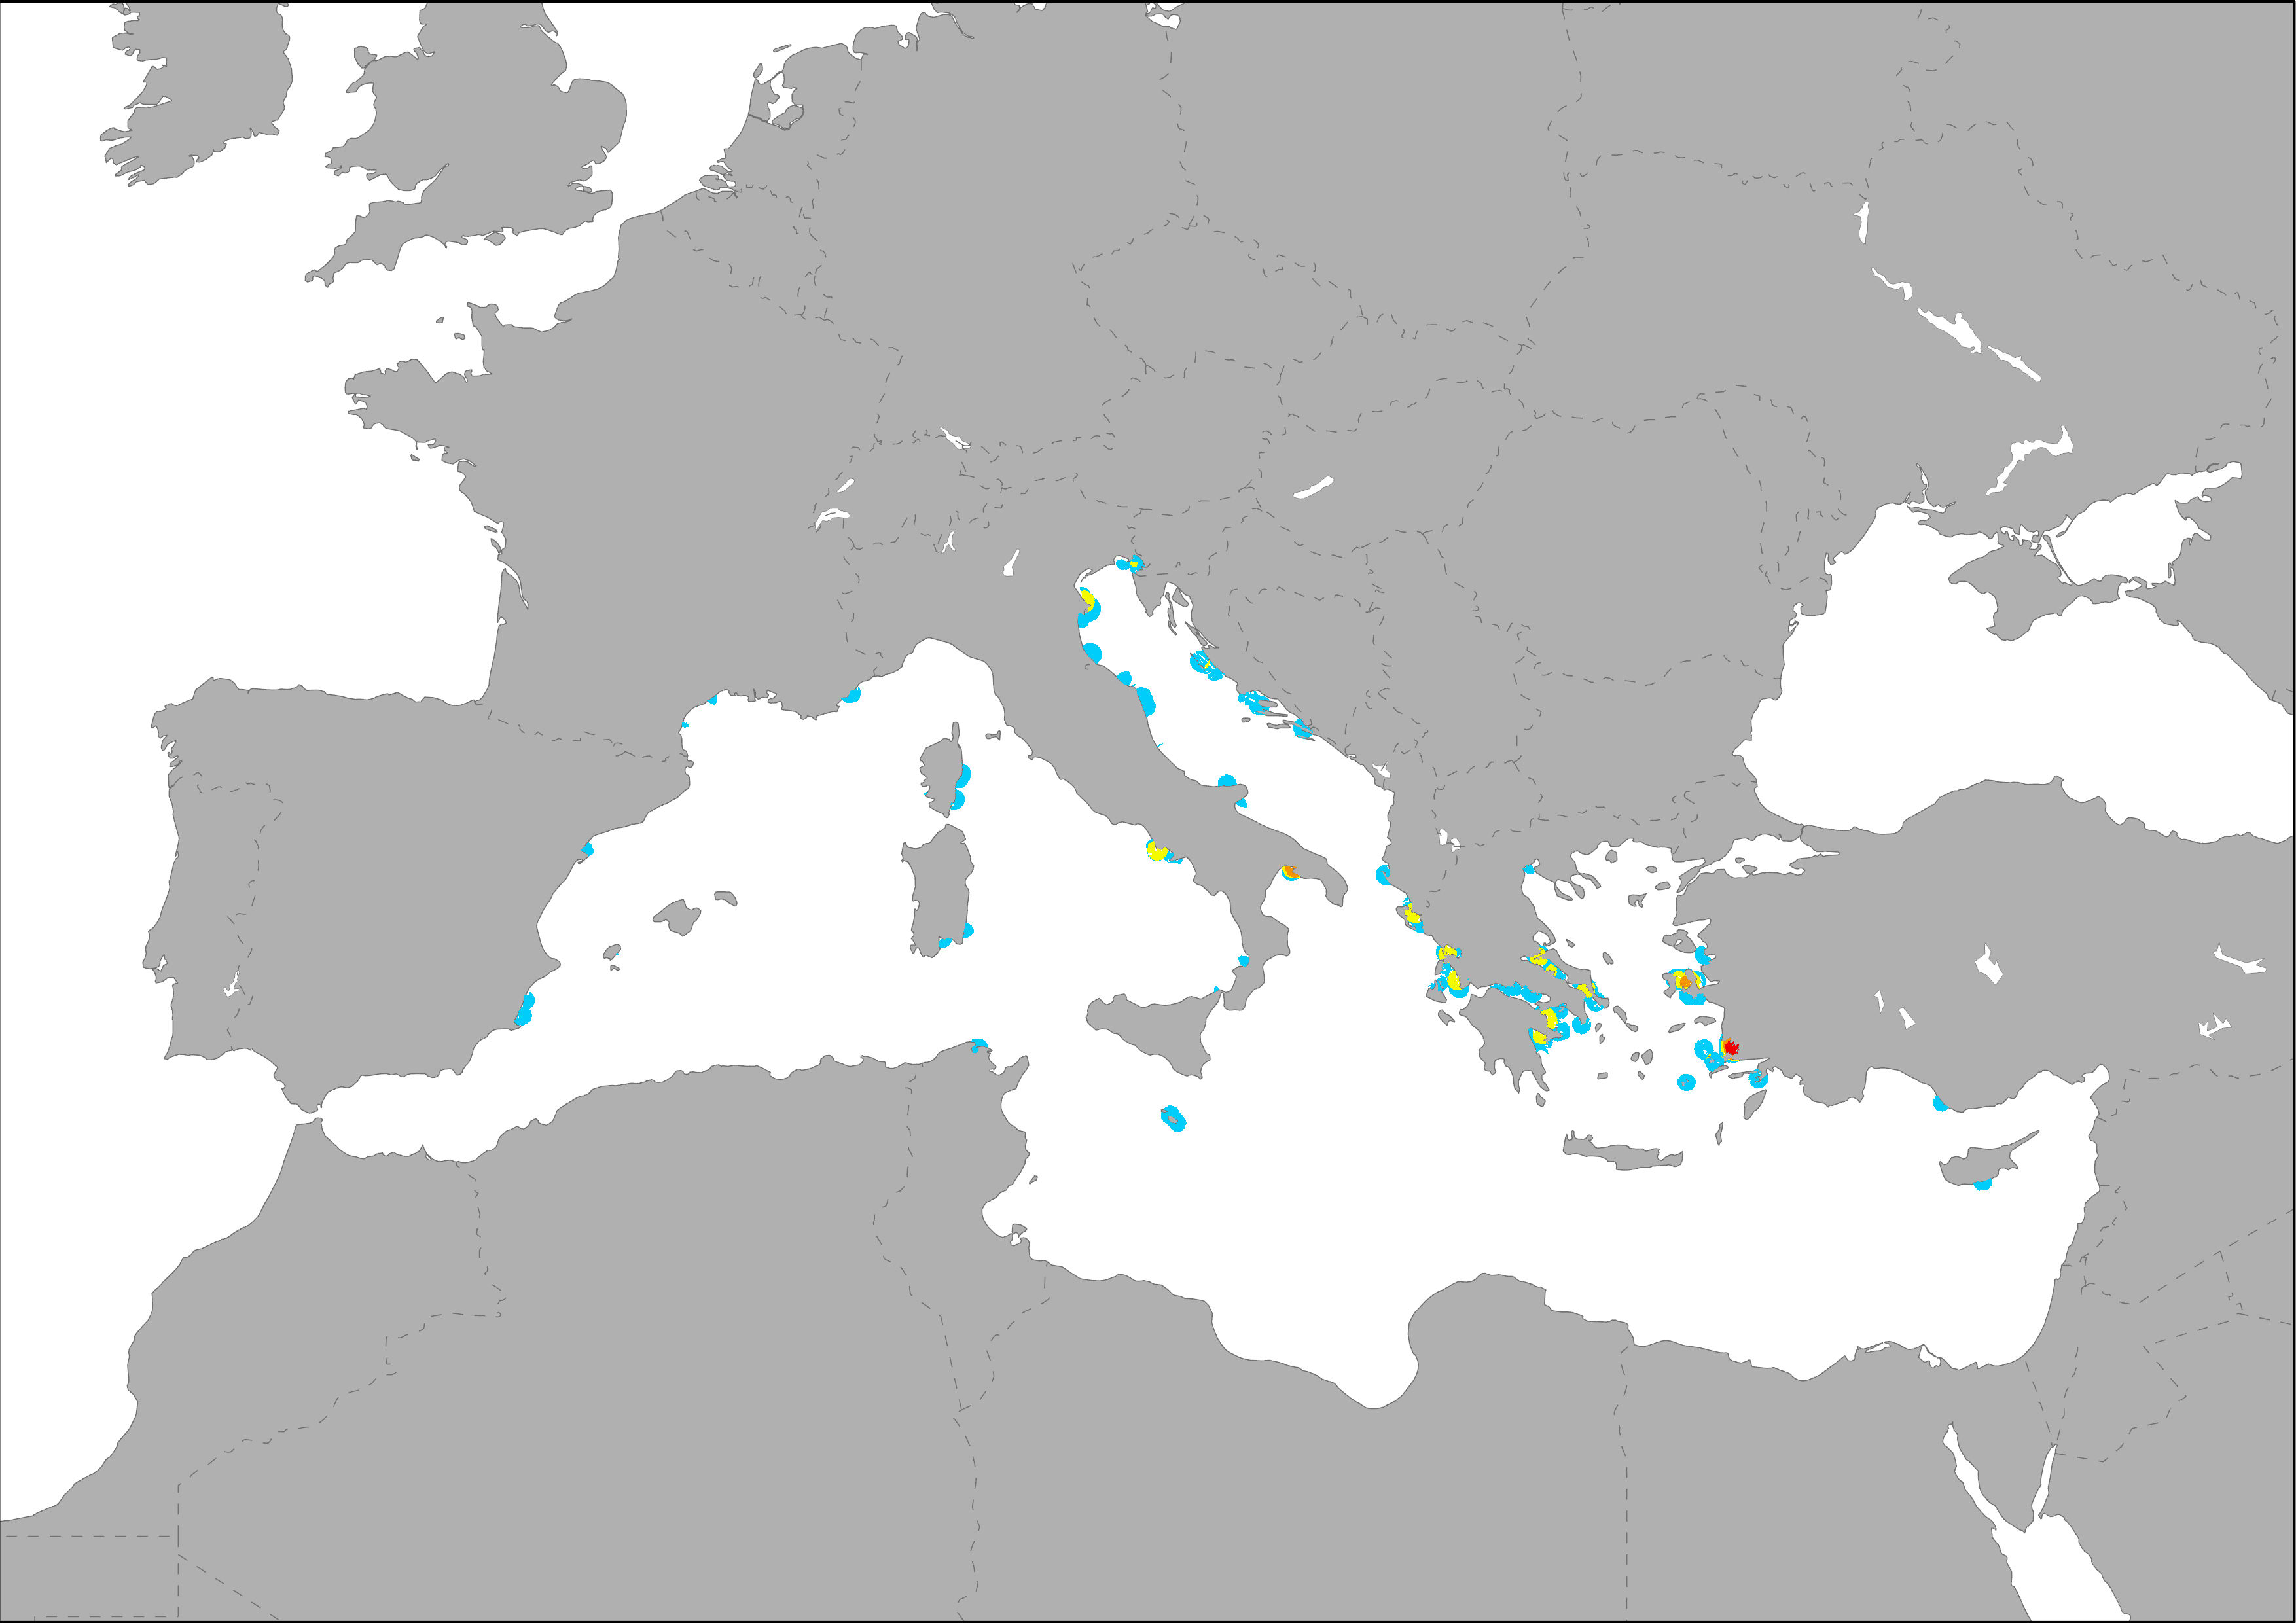
-

The map shows the distribution of main fishing ports in the Mediterranean Sea. Ports are ranked by tonnage per vessel (total gross tonnage, GT/number of vessels). This indicator is based on fleet stats of DG MARE, 2014.